How to set sales quotas that hold up: A framework from planning experts
A data-driven approach to reconciling growth targets, territory potential, capacity, and quota fairness.
How to set sales quotas that hold up: A framework from planning experts
See how we recommend setting sales quotas that stand up to scrutiny. See how Forma.ai experts balance growth targets, territory potential, fairness, and field reality.
A data-driven approach to reconciling growth targets, territory potential, capacity, and quota fairness.
A company can decide how much revenue it wants to generate. The harder question is how that ambition should be distributed across the field.
That is the real work of quota setting.
For Sales Compensation and RevOps leaders, you need to translate a financial target into individual quotas that reflect actual selling opportunity, withstand scrutiny for fairness, and still create enough stretch to move the business forward.
Get the allocation wrong and even a well-designed incentive plan can struggle to motivate the performance it was built to reward.
In Forma.ai’s Setting Quotas that are Fiscally Responsible and Motivating sales planning masterclass, Kyle Webster, Chief of Staff at Forma.ai, and David Gerardi, VP, Revenue Optimization, walked through how to make this translation using your data.
Their discussion pointed to a useful standard for any quota-setting exercise:
You should be able to defend both the number the business needs and the way that number has been distributed across the field.
Based on the walkthrough they shared live, here are four ways to get there.

1. Reconcile the financial target with what the field can realistically produce
Quota setting typically starts with a top-line number. Finance establishes the revenue target, and said target may then be further broken down by region, segment, business unit, product line, or another dimension before eventually reaching individual sellers.
A top-down allocation provides an important constraint: the sales quotas have to reconcile to the financial plan. But it can also obscure what those numbers require at the territory level.
If the national target translates into 30% growth for a territory where available market share, account opportunity, and historical productivity point to 10%, this difference deserves examination.
Bottom-up planning approaches the problem from the other direction. Historical performance, account opportunity, market potential, seller productivity, capacity, and other territory-level inputs are used to estimate what the field can reasonably produce.
This creates two useful views:
- Top down: What does the company need each part of the organization to deliver?
- Bottom up: What does the available opportunity suggest each part of the organization can deliver?

Kyle and David’s recommendation is to use both.
A bottom-up model can be operationally credible and still fall short of the growth expected by the board. A top-down model can add up perfectly while requiring territory growth or market-share assumptions that have little connection to conditions on the ground.
The value comes from examining the implications from both directions and reconciling them deliberately.
A material gap between the two can reveal leadership's assuming higher productivity, additional capacity, increased market share, greater product penetration, or another change that's not yet been reflected in the operating plan.
The gap is information and it's critical to surface it before simply spreading the difference across seller quotas.
Stretch still has a place in the plan
Reconciling these views also does not mean planning only to the level historical data already proves achievable, either.
Dominic Ballinger, VP of RevOps at Sage, described this tension recently on The Sales Compensation Show. Leadership needs targets capable of producing breakthrough growth, while “no one actually benefits if the people who need to execute this don’t believe in it, and don’t actually think it’s feasible.”
His approach is to triangulate ambition against the evidence available: total addressable market, past performance, competitor performance, and other indicators that provide a reason to believe in the target:
Ultimately, your analysis doesn't have to dictate the ceiling. It should make where expected performance ends and genuine stretch begins visible.
You'll also want to note whether achieving the corporate target requires a step-change in productivity, capacity, coverage, or market share in order to make that assumption explicit with leadership and beyond. Otherwise the planning process can turn an unresolved business requirement into higher seller quotas.
2. Choose a quota methodology that reflects the differences that matter
Once leadership has reconciled its overall ambition, the next question becomes more practical:
How should that target actually be allocated?
For this, there is a spectrum of quota-setting methodologies available.
At the simplest end, every territory might receive the same absolute dollar quota. A slightly more sophisticated approach could apply the same growth percentage to each territory’s prior-year performance.
Move further along the spectrum and the allocation can begin incorporating historical performance, account characteristics, market opportunity, whitespace, future potential, or predictive modeling.
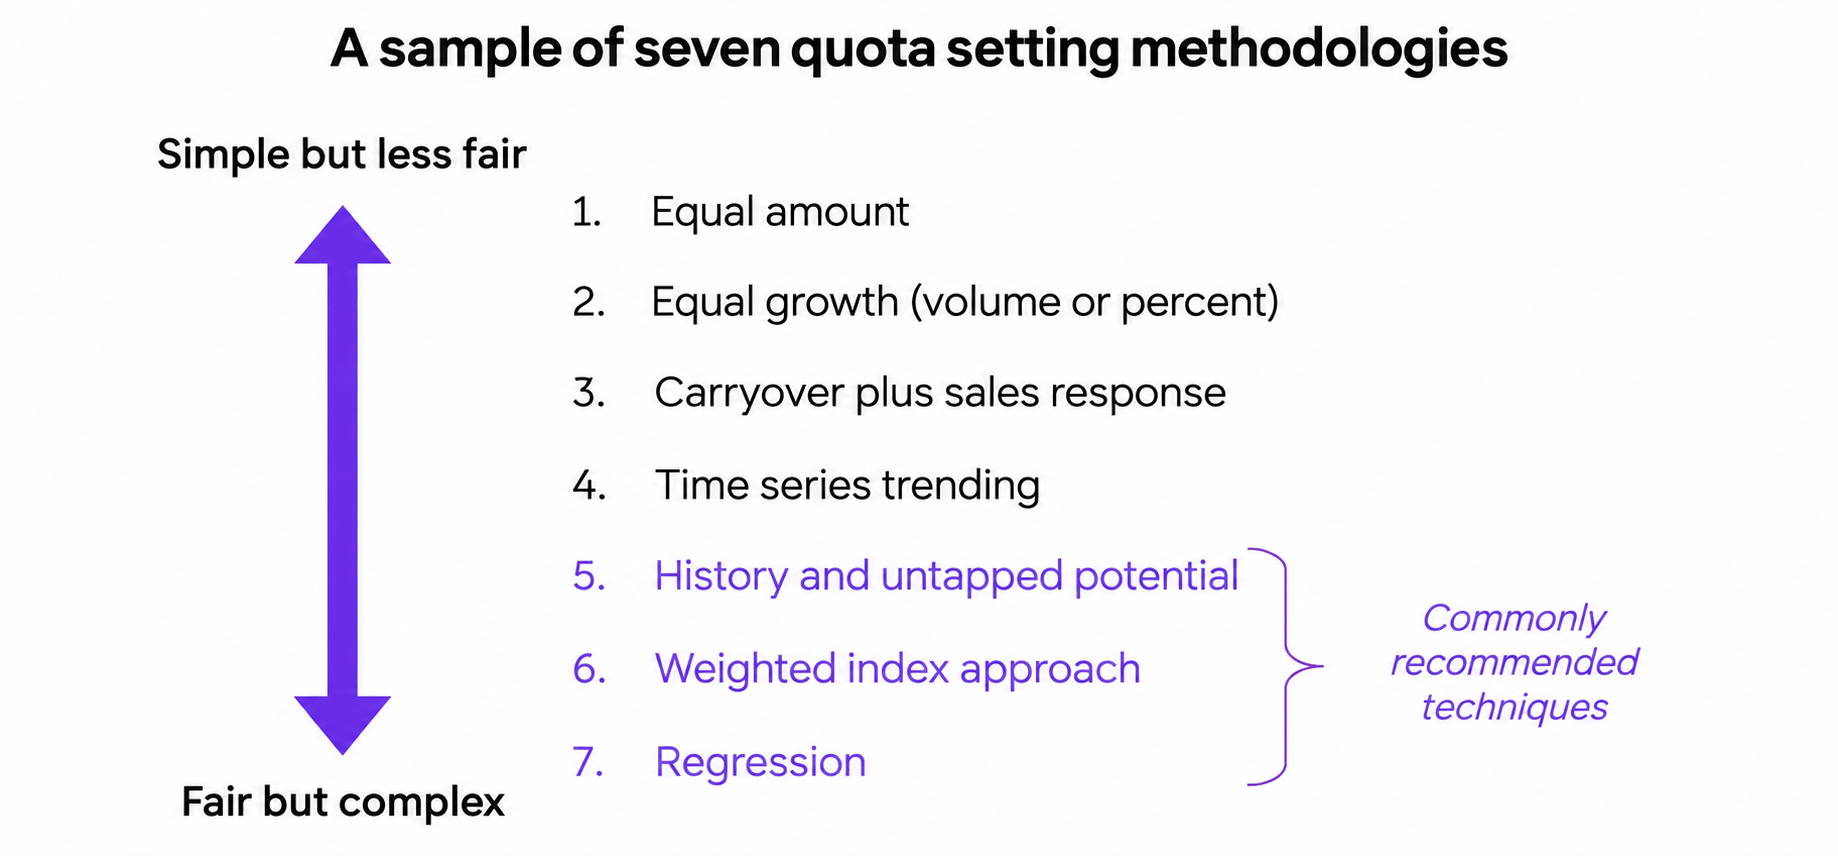
There's an important tradeoff here: simpler methodologies are easier to calculate, communicate, and administer. They also rely on broader assumptions about how similar territories are. More sophisticated approaches can account for meaningful differences in opportunity, but require better data, stronger modeling, and more rigorous testing.
Your goal shouldn't be to build the most complex quota model your organization can support. but instead you can ask: What information materially improves our ability to explain why one territory should carry more quota than another?
This helps keep sophistication useful.
Allocate growth according to opportunity, not convenient arithmetic
Two territories can finish the year at exactly the same revenue level and have very different potential for the year ahead.
One may contain a mature customer base with limited whitespace. Another may have significant untapped accounts, faster market growth, a different product opportunity, or a fundamentally different customer mix.
Historical production matters. It just cannot explain all of next year’s opportunity.
Depending on the business, a more robust allocation methodology might incorporate:
- historical sales or bookings;
- account and customer mix;
- estimated whitespace;
- market or territory potential;
- product opportunity;
- prior growth;
- seller or team capacity;
- ramp and tenure;
- expected productivity; and
- strategic business priorities.
The factors you choose should have a reason to be there. Each should improve your understanding of how much opportunity a seller or territory can reasonably support.
Turn territory potential into an allocation decision
During our masterclass, David demonstrated this with a simplified scenario: imagine 100 territories collectively producing $100 million.
Instead of applying the same uplift to all 100, the planning team can first segment territories according to their underlying opportunity. Those differences can then feed a quota distribution index that influences how the next target is allocated.

This is where territory planning becomes inseparable from quota setting.
A potential score sitting in a planning deck has limited value. It becomes useful when it changes an actual decision about how much growth a territory should carry.
David walks through the mechanics here:
The index creates a common basis for comparing territories whose opportunity may look very different. Depending on the business, it could incorporate prior production, account potential, whitespace, market characteristics, or other predictive factors.
You ultimately get a more defensible allocation.
Instead of debating whether a seller’s target simply feels high, leaders can inspect the assumptions underneath it.
- Is the territory’s potential overstated?
- Is last year’s production an unreliable baseline?
- Has capacity changed?
- Is a new product expected to create growth that is not reflected in the opportunity model?
Those are decisions leaders can work with.
There is an incentive compensation consequence too. If two sellers have materially different opportunities to reach quota, equivalent-looking targets can create very different probabilities of earning the same incentive outcome.
3. Backtest the methodology before sellers ever see the quota
As David and Kyle got into in the session, a quota methodology can appear entirely reasonable in a planning model and still behave badly in practice.
But you don't have to wait for next year to discover this.
Before deploying a new methodology, apply it to an earlier period for which you already know the actual performance results. Recalculate what quotas would have looked like under the proposed approach and see how they would have behaved.
We recommend looking at the output in two distinct ways: accuracy and fairness.
First: Does the attainment distribution expose a problem?
Start by looking at the distribution of quota attainment.
You're not looking for a mathematically perfect bell curve, or assuming every healthy sales organization will produce exactly the same distribution. You're looking for signals.
- Does a meaningful proportion of the field cluster around the intended performance level?
- Or does the methodology create large populations of sellers for whom quota appears either trivial or effectively unreachable?
Below, we see a good distribution—a normal bell curve with reps clustered around 100% attainment. This indicates that quotas are set fairly.

Compare this with a heavily dispersed or bimodal result:

A wide spread with substantial groups at either extreme should prompt another look at the methodology. This is common to see at organizations where there's no strong quota setting methodology in place, producing inaccurate quotas.
Ultimately, aggregate performance can hide a poor allocation model.
The organization may land close to its company revenue target while individual territories have dramatically different probabilities of success.
Company attainment tells you whether the number was reached. The distribution, however, helps you investigate how well it was allocated.
Second: Is a structural factor changing someone’s probability of attainment?
Next, it's a good idea to segment the results according to variables where sellers have limited control.
Depending on your model, this might include:
- territory size or potential;
- geography;
- market or segment;
- account mix;
- number of accounts;
- seller tenure;
- product mix; or
- another defining territory characteristic.
Then compare the attainment patterns.
In the masterclass example, David and Kyle showed territories grouped by size. A broadly similar attainment range across small, medium, and large territories suggests the allocation methodology is accounting reasonably well for that characteristic:

A very different picture emerges if larger territories consistently achieve materially higher attainment:

If you see significant skew, with larger territories achieving much higher attainment, this suggests a bias. The pattern above doesn't tell you automatically why there's a problem, but it tells you where to investigate.
- Perhaps territory potential is underweighted.
- Maybe account mix explains the difference.
- Maybe the segmentation itself is hiding another characteristic.
How do you conduct this analysis?
- Building off quota accuracy analysis, group territories based on a certain attributes (e.g. rep tenure, territory size, etc.).
- For each group of reps, calculate percentage of earnings coming from each component or product category to determine if a bias exists.
Ultimately, with this analysis, if a variable has been identified, the next quota setting process needs to sensitize for this. For example, if you discover smaller territories have a bias towards higher attainment, you need to understand why and ensure set quotas/assigned territories account for this.
David shows how the analysis can be used to isolate those questions in this brief example from the session:
Overall, the goal of fairness testing isn't to manufacture identical attainment across every population. It's diagnostic.
- If high-potential territories systematically over-attain, your methodology may not be assigning them enough quota.
- If newer sellers consistently under-attain, the issue could sit in ramp assumptions, territory assignment, productivity expectations, enablement, or some combination of those factors.
Once you've identified a pattern, change the methodology and run the analysis again.
Calculate ---> Test ---> Diagnose ---> Refine.

An iterative loop is one of the biggest differences between merely distributing quotas and engineering them.
Further, ensure you are comparing like with like
Complex enterprise sales structures add another analytical trap.
Frontline quota carriers, managers, overlays, and hybrid roles can all participate in the same underlying revenue result. Their quotas may also be built in different ways.
As Kyle explained during the session, an overlay role can have its own allocation process and weighting factors, while a manager or direct overlay quota may instead be built from the quotas assigned to frontline sellers.
This relationship has to carry through into the analysis.
If overlapping roles are indiscriminately pooled into the same fairness testing, the underlying attainment can effectively be counted more than once and distort the resulting picture.
For larger sales organizations especially, fairness testing is only as sound as the population being compared.
4. Use manager judgment as governed planning intelligence
Now, eventually, the model has to meet the field. And your sales leaders know things your dataset may not.
They know that a major account is going through a merger. They know a significant opportunity assumed in the plan disappeared last week. They understand competitive pressure, relationship dynamics, and account-level realities that may not yet exist cleanly in the planning data.
Ignoring this context can reduce quota quality. And uinlimited manual overrides create a different problem.
The stronger approach is to give managers meaningful influence within explicit parameters.
A sales leader might receive:
- the proposed quota for each territory;
- the methodology used to calculate it;
- relevant historical performance;
- selected indicators of territory potential; and
- a defined range within which adjustments can be proposed.

Changes can then move through the appropriate approval hierarchy while maintaining reconciliation to the broader financial target.
This turns manager judgment into governed planning intelligence.
If a leader wants to materially reduce one territory’s quota, the process should naturally surface the next question:
What changed in the underlying assumption, and where does that quota go instead?
There is a second benefit. Once quotas reach sellers, frontline managers become the face of the methodology. If they can't explain where the number came from, confidence in the process can disappear quickly.
Giving managers structured involvement after the analytical work has been done gives them enough context and agency to flag legitimate exceptions without rebuilding the entire plan through anecdote.
A strong quota-setting process should survive four tests
Before the final numbers are released, leaders should be able to answer four questions.
- Financial: Do the quotas collectively support the company’s revenue objective?
- Opportunity: Does the allocation reflect meaningful differences in territory potential, capacity, and expected productivity?
- Empirical: What happens when we backtest the methodology, including its accuracy and fairness across comparable populations?
- Operational: Can sales leadership explain the resulting quotas and manage legitimate exceptions without breaking the model?
Weakness in one area tends to surface somewhere else.
- An unrealistic quota can become an incentive-compensation problem when sellers stop believing the upside is attainable.
- A poorly balanced territory can look like an individual performance problem.
- A corporate growth assumption can show up as widespread quota under-attainment even when the deeper constraint is capacity or market opportunity.
This is why mature quota setting requires you look beyond the final number.
Better quota setting creates better compensation decisions
Quota setting may happen before incentive compensation design in the planning calendar, but the decisions are tightly connected.
Quota establishes the performance standard against which much of the compensation plan operates. Territory design influences the opportunity available to reach it. Incentive mechanics determine how economically valuable different levels and types of performance become.
When quota is poorly calibrated, changing accelerators or adding another incentive can address the symptom while leaving the underlying planning issue untouched.
A stronger quota-setting process gives leaders another option: determine whether the performance problem originates in quota, territory, capacity, coverage, productivity, or incentive design before deciding which lever to pull.
That is ultimately what a better methodology provides.
Not certainty, but a much stronger evidence base for the decisions that follow.
Before approving the next plan, ask:
- What evidence explains how the corporate target was distributed?
- What assumptions about growth, capacity, and market opportunity are embedded in those quotas?
- Have we tested whether the methodology systematically advantages particular territories or seller populations?
- Where did manager judgment change the output, and why?
- Can leadership explain the methodology clearly enough to stand behind it?
If those are difficult to answer, the quota-setting exercise probably isn't finished.
For a broader primer on quota definitions, types, examples, and their role within sales planning, read our guide to sales quotas.
The role of a full-stack SPM platform in quota setting
If your organization has reached a certain level of maturity, SPM software can significantly streamline quota setting and management.
As discussed in the session, managing quotas across territories, forecasts, and historical performance is complex. A full-stack SPM platform unifies territories, quotas, and incentives in one system, ensuring that all data is integrated and based on the most accurate information.
An advanced SPM platform empowers sales and revenue operations leaders to manage the entire sales performance process within a single system. This creates a seamless workflow that ensures fairness and consistency throughout the planning and execution stages.
The right SPM platform can take much of the manual work out of the process above, allowing you as a sales ops team to focus on strategy, ensuring that quotas are not only fair but also achievable.
Sales quota setting FAQs
How many iterations are typically done to reconcile quota expectations across the org?
Because you generally get one chance to roll out and explain the quotas to the field and why they are fair, David and Kyle shared that you typically have one round of iteration at the beginning (as you receive the top-level number that needs to be allocated from Finance), then one subsequent round of iteration to cascade the quotas down and run the refinement process with your sales leaders.
Should sales quotas be set top-down or bottom-up?
In practice, Kyle and David recommended use both perspectives. Top-down quota setting ensures individual and territory quotas reconcile to the company’s financial target. Bottom-up planning tests that ambition against historical performance, territory potential, seller capacity, and other evidence of what the field can reasonably produce.
The value comes from reconciling the two. If the bottom-up opportunity model falls materially short of the top-down target, identify the assumptions required to close that gap, such as higher productivity, additional capacity, greater market share, or increased product penetration, before embedding the difference in seller quotas.
How should territory potential factor into sales quota setting?
Territory potential helps distinguish between territories that may have similar historical performance but very different opportunities for future growth.
Organizations can incorporate factors such as account potential, whitespace, customer mix, market characteristics, product opportunity, and historical performance into a territory index or other allocation methodology. The objective is to make meaningful differences in available opportunity influence how much quota each territory carries.
How can you test whether sales quotas are fair?
Backtest the proposed quota methodology against historical performance, then compare attainment across relevant groups.
For example, segment sellers or territories by territory potential, geography, account mix, tenure, market, or another structural factor outside the seller’s immediate control. If one comparable population consistently has a materially higher or lower probability of attaining quota, investigate whether the methodology adequately accounts for that difference.
Fairness testing is diagnostic. The goal is not identical attainment across every group, but identifying systematic differences that the quota methodology may be creating or failing to address.
How do you set stretch quotas without making them unrealistic?
Start by making the source of the stretch explicit.
Use market potential, historical performance, capacity, productivity, competitive performance, and other available evidence to establish a credible baseline. Then identify what must change for the business to achieve a target above that baseline.
A stretch target may require higher productivity, new capacity, additional market share, stronger product performance, or another step-change in the business. Making those assumptions visible allows leadership to distinguish an intentional stretch from a quota that simply exceeds the opportunity available to the field.
When should sales managers be allowed to adjust quotas?
Manager input is most useful after the initial quota methodology has produced a data-backed recommendation.
Give sales leaders visibility into the proposed quota, its underlying assumptions, and relevant territory data, then allow adjustments within defined parameters and approval rules. Managers can bring forward account- and market-level information the model may have missed without turning quota setting into an unrestricted negotiation.
Material overrides should also be explainable: what changed in the underlying assumption, and how does the adjustment affect the broader quota allocation?